Nice airport traffic ✈️
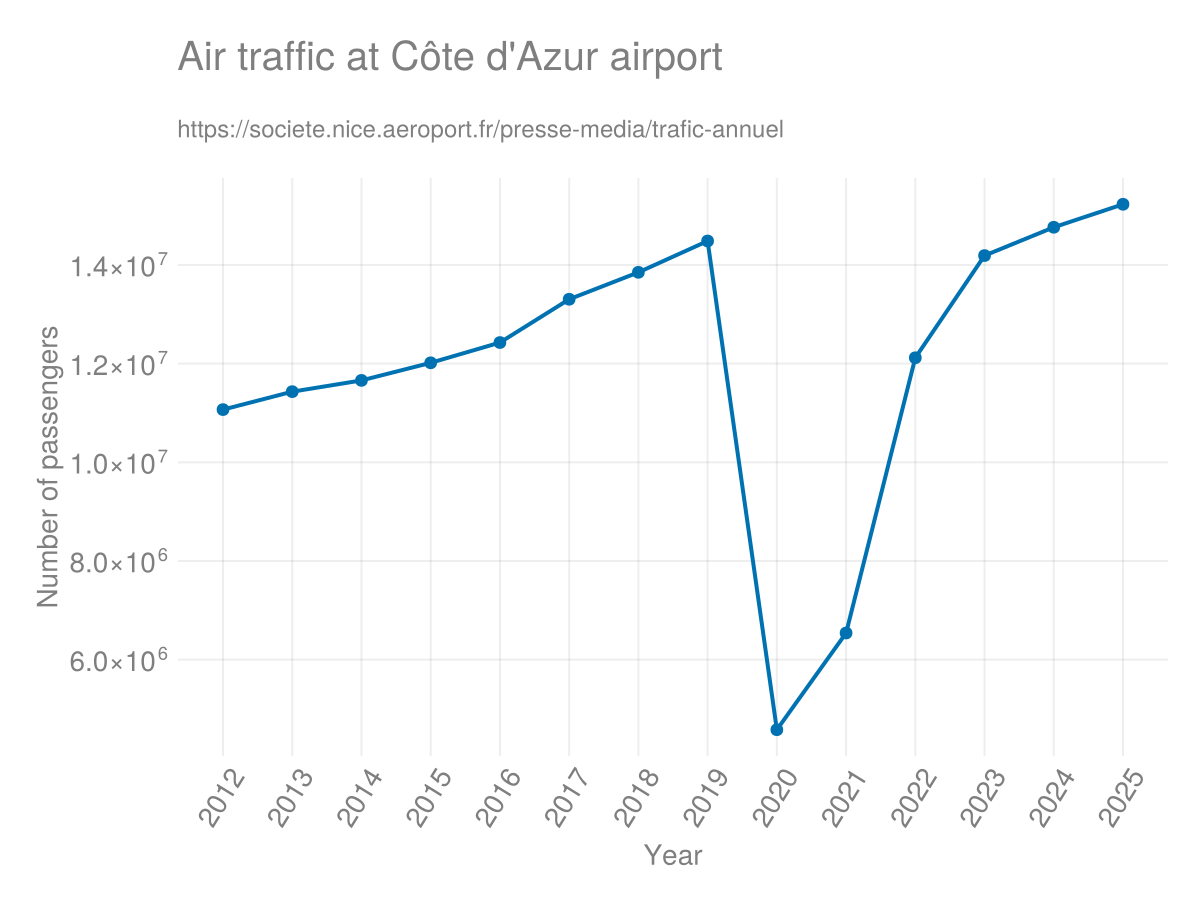
using Dates, CairoMakie

function airport_pass()
    tick_years = Date.(2012:2023)
    DateTick = Dates.format.(tick_years, "yyyy")

    traf_nice = [11_068_465, 11_432_028, 11_535_824, 11_889_288,
        12_300_643, 13_172_535, 13_719_099, 14_356_977,
        4_525_639, 6_452_074, 12_008_810, 14_082_130]

    traf_nice = [
    	Date(2012) 11_068_465;
    	Date(2013) 11_432_028;
    	Date(2014) 11_660_208;
    	Date(2015) 12_016_730;
    	Date(2016) 12_427_427;
    	Date(2017) 13_304_782;
    	Date(2018) 13_850_561;
    	Date(2019) 14_485_423;
    	Date(2020) 4_580_459;
    	Date(2021) 6_540_424;
    	Date(2022) 12_119_043;
    	Date(2023) 14_189_965;
    	Date(2024) 14_763_753;
    	Date(2025) 15_229_664;
    	]

    DateTick = Dates.format.(traf_nice[:,1], "yyyy")

    fig = Figure()
    ax1 = Axis(fig[1,1])
    scatterlines!(ax1, 1:length(DateTick), traf_nice[:,2], linewidth=2)
    ax1.xticks = (1:length(DateTick), DateTick)
    ax1.xticklabelrotation = 45.0
    ax1.xlabel = "Year"
    ax1.ylabel = "Number of passengers"

    titlelayout = GridLayout(fig[0, 1], halign = :left, tellwidth = false)
    Label(titlelayout[1, 1], "Air traffic at Côte d'Azur airport", halign = :left,  fontsize = 20)
    Label(titlelayout[2, 1], "https://societe.nice.aeroport.fr/presse-media/trafic-annuel", halign = :left, fontsize = 12)

    fig
end

theplot = with_theme(airport_pass, theme_light())
save("airport_traffic.png", theplot)
Enjoy Reading This Article?
Here are some more articles you might like to read next: